Chart of the Month Package Announcement

August 20, 2012

We have decided to release 12 charts in the coming year as a Chart of the Month package.

Our goal for this package is to provide you with 12 currently traded Markets, 6 Stocks and 6 Commodities, at a low price per chart.

For $1156.00 you receive 12 full size chart prints made by the hand of W.D. Gann.  That is less than $100 per chart.

The difficult part for us is to decide which charts to include.  Here is what we have selected for you so far…

12charts 0003

Boeing, Chase National Bank, Chrysler, Coca-Cola, General Electric, General Motors, Paramount, and Warner Brothers  for the stocks.

We are also considering adding a wildcard chart to the package.  One of W.D. Gann’s Lottery charts.  Let us know if you are interested in seeing one of these rarities in the package.
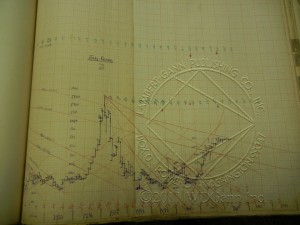
12charts 0007

July Cocoa, Spot Cotton, July Corn, May Coffee, Soybeans and Wheat for the commodities.

These will be a mix of monthly and weekly charts.

You’ll note that there are more stocks than 6 there-it’s because we need your help deciding..

Please let us know which stocks and commodities you would like to see included in this package.

While we tune in this package we will be offering it to our clients for the price of $999.00.  As soon as we send our first package, the sale price will disappear.

Purchase the package now here.

We hope to ship three of your charts as close to September 21st as possible, with three more coming every 3 months.

One shipping price will get you 4 quarterly packages.

These charts will be available individually, but they will be priced at $175+ per chart.

Add comments here or email suggestions to info@wdgann.com

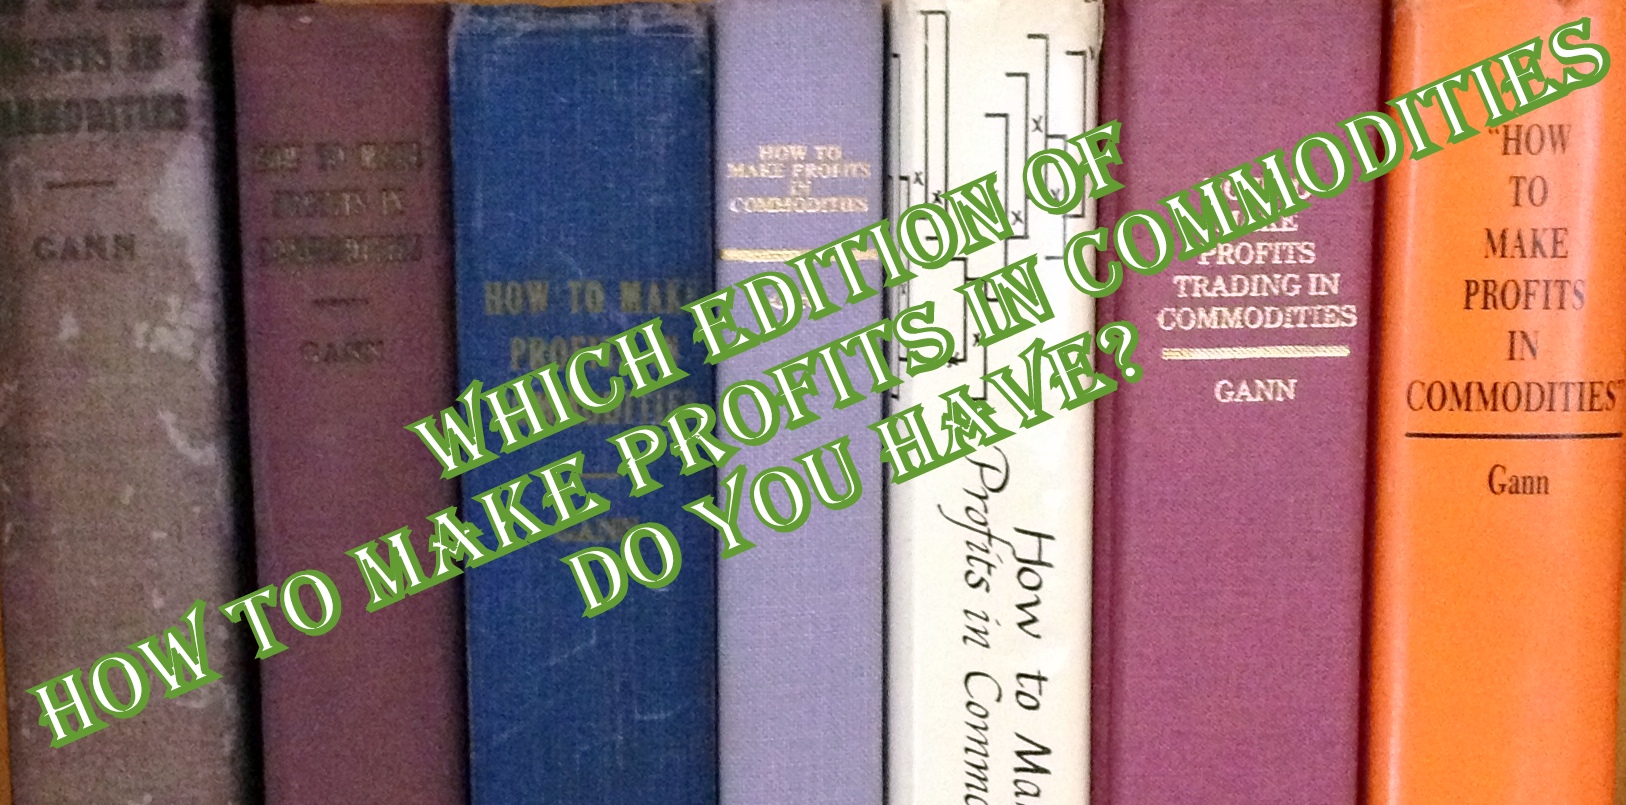
Which edition of “How to Make Profits in Commodities” do you have?

August 16, 2012

blogheading12

Did you know there are eight different editions of W.D. Gann’s “How to Make Profits in Commodities”?

While the last five editions are very similar except for dust jackets and printing number, the two I am going to tell you about may surprise you.

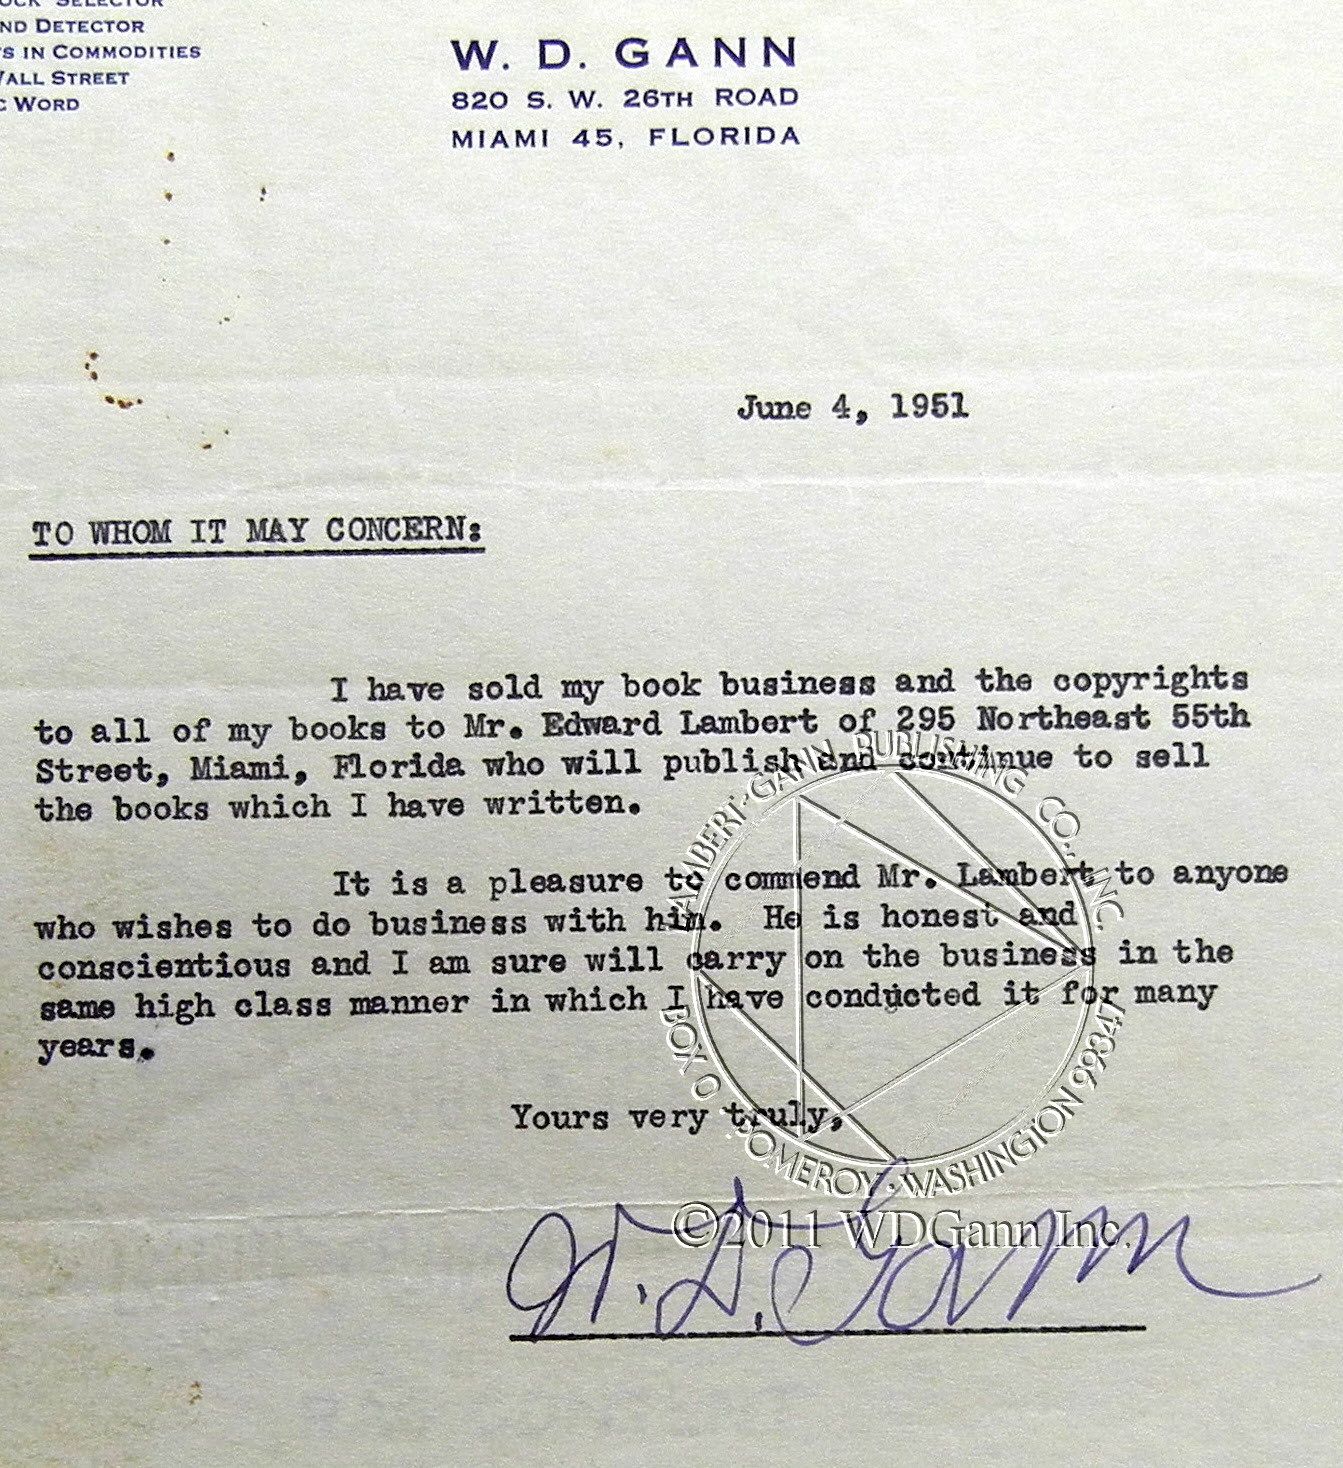
In 1951, W.D. Gann sold his book business and copyrights to Ed Lambert, his partner.  They had printed an edition of “How to Make Profits in Commodities” at the same time.

EdLambertSale

As part of the business deal, W.D. Gann updated “How to Make Profits in Commodities” with forecasts of the coming years.

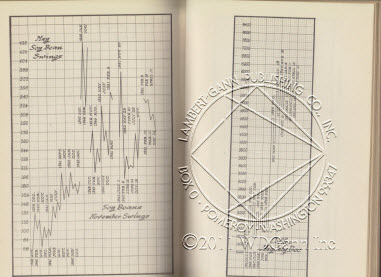
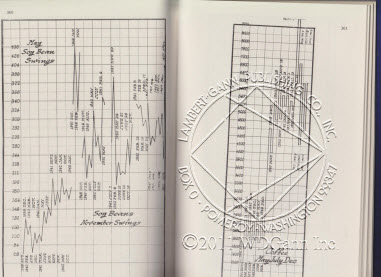
A total of eight charts in the back of the book were changed showing forecasts for the next 5 years!  Quite a confident and calculated move.

Would you purchase a book showing a reliable forecast for the next 5 years?

The updated charts included May Corn, November Soybeans, Coffee, October Cotton, Cotton Seed Oil, October Eggs, Rubber, and May Wheat.

Did the forecasts come true??

How did W.D.Gann come up with these forecasts?  The Ephemeris, his master cycle charts, or his mechanical method as explained in the Commodity Course?

That is up to you to find out-Let us know with a comment what your findings are.

So Ed Lambert, the copyright holder,  printed out a second version of the 1951 “How to Make Profits in Commodities” with the updated charts in the same year.

THERE ARE TWO 1951 EDITIONS!

But there are differences…

It’s not as easy as looking at the copyright page-as they are EXACTLY THE SAME.

The biggest difference is the addition of the forecasts, but there is an easier way to tell which version you have.

What color is the cover of the book?  Blue or Purple? The purple book is the earlier 1951 edition.

There are also variations in the placement of page numbers over the updated charts.

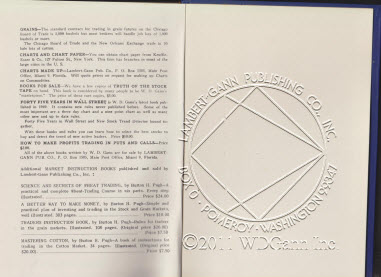
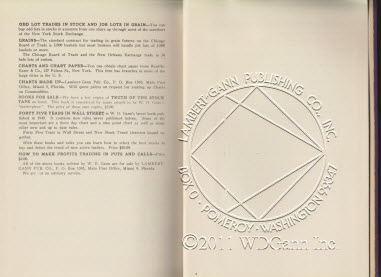
Lastly, Ed Lambert changed the advertising in the rear of the book.

Below are pictures illustrating some of these differences between the two 1951 versions, note the binding colors.

Happy Hunting!

-Cody

Copy of 1Copy of 2

Copy of 3Copy of 4

Copy of 5Copy of 6

To purchase the latest version of “How to Make Profits in Commodities”, CLICK HERE.